.jpeg)
Amazon SageMaker has become the go-to platform for building, training, and deploying machine learning models at scale. But once your model is live, how do you ensure it performs well, scales properly, and doesn’t silently fail? That’s where Instana comes in.
In this article, we’ll explore how to bring full-stack observability to your SageMaker workflows using Instana — enabling you to track, understand, and optimize the performance of your machine learning infrastructure and applications.
Why observability matters in machine learning
Deploying an ML model isn’t the finish line — it’s just the beginning. Models degrade over time, infrastructure behaves unexpectedly, and APIs become bottlenecks. Here’s what observability gives you:
- Insight into infrastructure performance (CPU, memory, GPU, I/O)
- Visibility into service latency and throughput
- Detection of anomalous behaviors in model usage
- Proactive alerting when performance thresholds are crossed
Amazon SageMaker offers logs and metrics, but Instana provides the holistic, automated, and AI-powered observability layer that ties everything together.
What is Amazon SageMaker?
In short: a fully managed service from AWS to build, train, and deploy ML models at scale. It handles everything from data preprocessing to endpoint hosting. You can:
- Train models using built-in algorithms or custom scripts
- Deploy models to scalable endpoints
- Automate training pipelines using SageMaker Pipelines
- Monitor model performance using built-in tools like CloudWatch
But SageMaker by itself doesn’t offer deep observability or automatic tracing — that’s where Instana steps in.
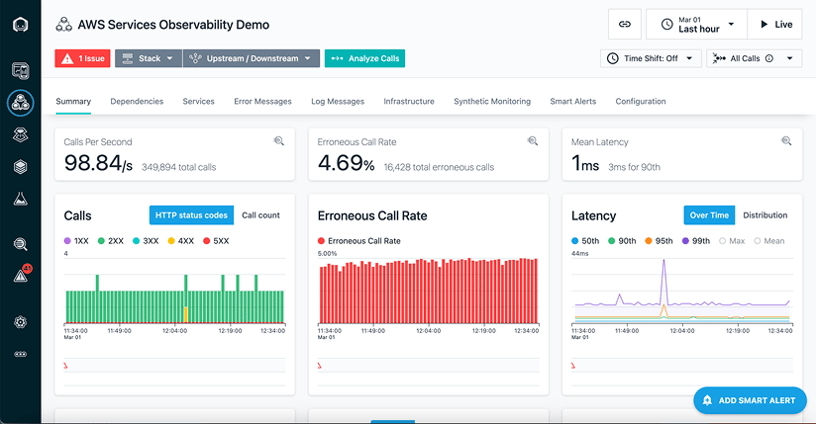 ↑ Instana realtime monitoring dashboard
What is Instana?
Instana, an observability platform by IBM, provides real-time, AI-powered monitoring across hybrid cloud environments. It automatically detects services, traces requests, and visualizes dependencies in dynamic microservice architectures.
It’s ideal for environments where applications are distributed, containerized, or constantly changing — like ML workloads.
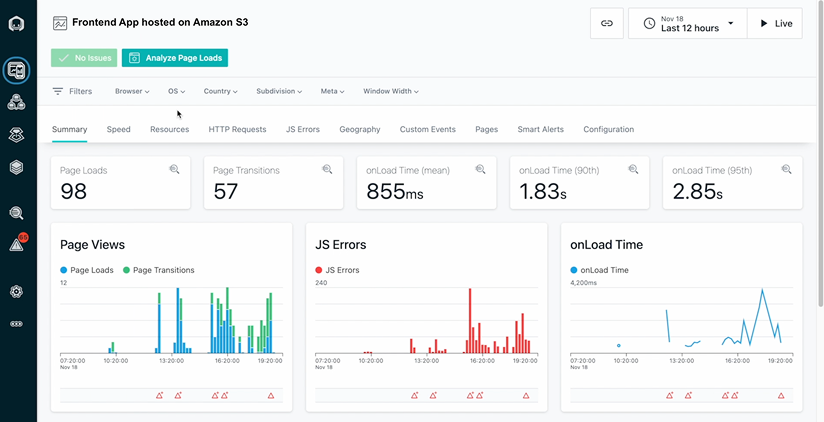 ↑ Instana realtime monitoring dashboard
Integrating Instana with Amazon SageMaker
You can observe SageMaker workloads by integrating Instana agents into the infrastructure and enabling custom metrics and traces. Here’s how:
1. Instrument the Inference Endpoint
Add Instana’s AutoTrace SDK or use OpenTelemetry to capture requests going into your SageMaker endpoint. If your model is deployed via a Python Flask or FastAPI app, you can inject tracing easily.
2. Monitor EC2 Instances & Containers
If you’re running SageMaker Training Jobs or hosting models on EC2/GPU instances, install the Instana host agent to monitor:
- CPU, GPU, memory, disk I/O
- Network traffic
- System-level logs
For containerized workloads (like using SageMaker Inference Containers), use Instana’s container sensors for ECS or EKS.
3. Use Custom Metrics for Model Behavior
Push custom business or ML metrics to Instana (via StatsD, Prometheus, or API), such as:
- Prediction latency
- Confidence scores
- Drift indicators
- API error rates
These can be visualized in dashboards and correlated with infrastructure and application performance.
Final Thoughts
Machine learning in production is no longer just about accuracy — it’s about reliability, speed, and scale. With Amazon SageMaker powering your models and Instana observing your systems, you get the best of both worlds: intelligent automation and full-stack visibility.
If you're deploying ML models at scale, Instana is your observability co-pilot.